
GROWMERA · SCALE & MEASURABLE GROWTH
Marketing performance becomes useful when you can connect a campaign to a qualified conversation, a sales opportunity and a customer. These seven metrics help B2B teams see where progress happens, where it stalls and what to improve next.
A report can show rising clicks while the sales team still struggles to book relevant meetings. Another campaign may produce fewer enquiries but create better commercial conversations. The difference becomes visible when marketing and sales use the same definitions and follow the same group of leads through the buying process.
This guide offers a practical measurement framework, a worked example and a review routine. You can begin with a spreadsheet and a clear owner for each record, then connect the workflow to your CRM as the process becomes more established.

Start with clear marketing performance definitions
Before building a dashboard, agree on what each stage means. An enquiry is a unique person or company expressing interest. A qualified lead meets your agreed criteria. A held meeting is a conversation that actually took place. An opportunity has a confirmed business need and a documented next step. A customer is counted only when your agreed commercial acceptance condition is met.
Choose one counting unit and keep it consistent. If three people from one company contact you about the same project, decide whether that represents three contacts or one buying opportunity. Mixing contact counts with company counts makes conversion rates difficult to interpret. For the example below, each enquiry represents one unique potential customer with one potential opportunity.
Define qualification with sales: relevant service need, target market, suitable company profile and a realistic next step. Budget and timing may matter, but avoid automatically rejecting a strong prospect simply because those details are not yet known. Keep “awaiting review” separate from “not qualified” so delayed administration does not look like poor demand.
Finally, choose an observation window. Leads acquired this week may need several weeks to become customers. A cohort groups leads by when they first entered your process and follows their later outcomes. Comparing cohorts at the same age makes marketing performance more meaningful than dividing this month’s spend by unrelated sales closed this month.
1. Qualified lead volume: measure relevant demand
Measure: the number of unique leads that meet your qualification criteria within the chosen cohort.
This is the starting point for understanding whether your marketing is attracting suitable buyers. Keep the original enquiry count alongside it. Forty qualified leads from one hundred enquiries tells a different story from forty qualified leads from four hundred enquiries, even though the qualified volume is identical.
Review the reasons behind disqualification. Repeated requests for an unavailable service may suggest unclear messaging. Interest from outside your service area may point to targeting or location information. Duplicate forms may indicate that people are unsure whether their first submission worked. Each reason leads to a different improvement.
A useful dashboard shows qualified, unqualified and unreviewed records separately. Assign someone to complete missing reviews before making a major budget decision. If the underlying demand is weak, revisit the offer and audience in your lead generation strategy; if qualified demand is healthy, examine the next stage before adding more traffic.
2. Qualification rate: connect volume with fit
Formula: qualified leads ÷ all unique enquiries × 100.
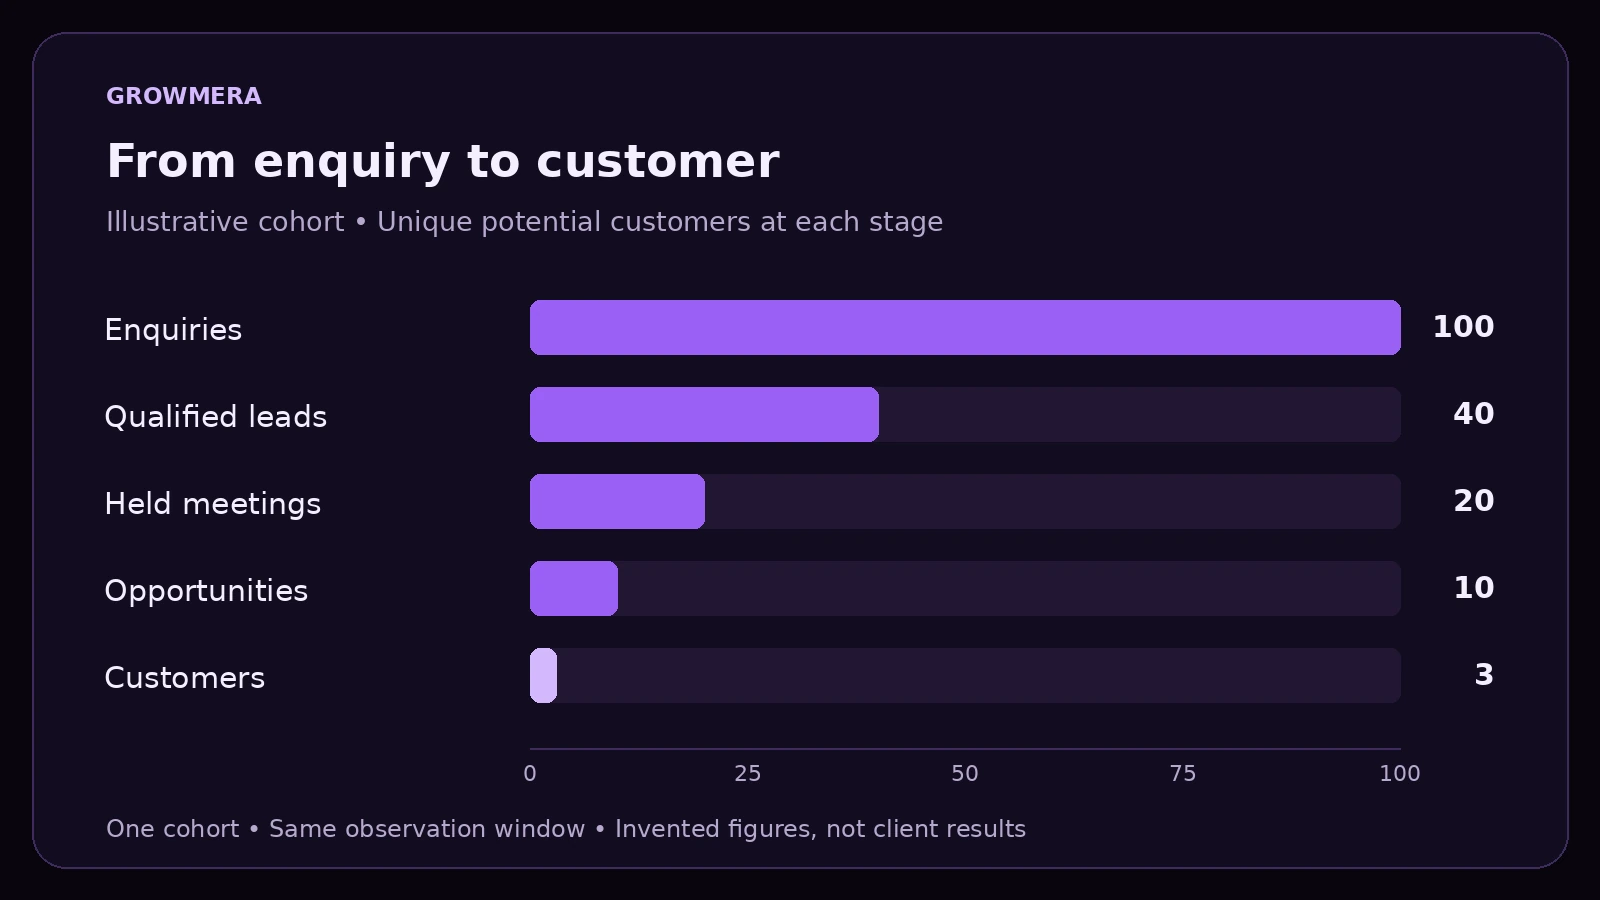
This marketing performance metric shows the share of incoming enquiries that meet your criteria. In the worked example, forty qualified leads from one hundred enquiries gives a qualification rate of 40%. The denominator is all enquiries, including any that are still awaiting review.
You may also track a rate based only on reviewed enquiries, but label it differently. Otherwise, one team may report 40% while another reports a higher number from the same underlying records. Neither figure is useful until everyone understands which records are included.
A lower rate does not automatically mean a campaign is failing. A broader campaign may still produce enough suitable leads at an acceptable cost. Evaluate the rate alongside qualified volume and cost. Use rejection reasons to improve ad wording, service descriptions and landing page clarity, then observe the effect on a comparable cohort.
3. Cost per qualified lead: include the right costs
Formula: allocated marketing acquisition cost ÷ qualified leads.
Cost per qualified lead, or CPQL, helps compare the effort required to attract relevant demand. Decide whether your cost includes only media spend or also content production, agency work and other acquisition activity. Use a clear name for each version rather than presenting an advertising-only figure as a complete marketing cost.
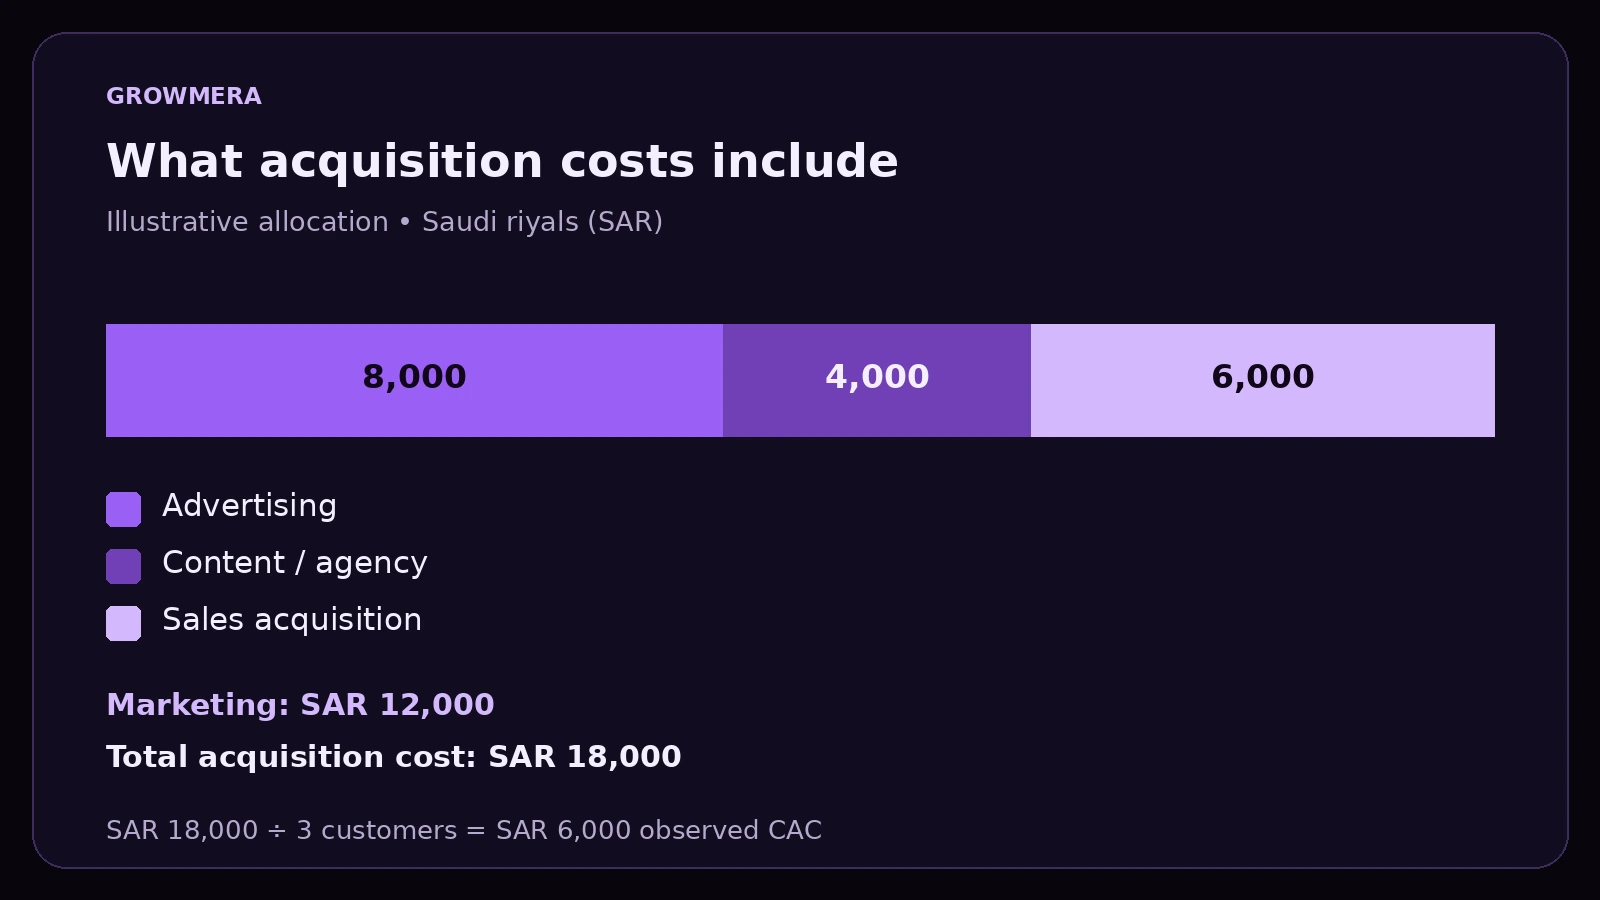
Suppose a campaign produces forty qualified leads and its allocated marketing costs total SAR 12,000. The CPQL is SAR 300. If you counted only SAR 8,000 of advertising spend, the advertising-only CPQL would be SAR 200. Both calculations are valid for their stated scopes, but they answer different questions.
For channel comparisons, document how you allocate shared costs. A landing page serving several campaigns should not be charged entirely to one channel without explanation. Consistent allocation is more useful than a polished number that changes its meaning every month. Review this metric alongside opportunity creation before declaring one channel the best performer.
4. Held meeting rate: check the handoff to sales
Formula used here: qualified leads with at least one held meeting ÷ qualified leads × 100.
Count prospects who attended a meeting, not every calendar invitation. Several meetings with the same lead should not increase the numerator above one for this particular metric. You can separately track total meetings or attendance among booked meetings when those questions matter.
A weak held meeting rate may reflect slow follow-up, confusing booking steps, unsuitable times or an unclear reason to meet. Examine those operational details before assuming that the audience is wrong. The sales team should record the outcome and the next action, including a reschedule when appropriate.
With twenty qualified leads attending a meeting out of forty qualified leads, the rate is 50%. This is not the same as the show-up rate among booked appointments. Our lead follow-up guide explains how a clear owner and next step support the transition from interest to conversation.
5. Opportunity rate: measure commercial progress
Formula used here: qualified leads becoming a sales opportunity ÷ qualified leads × 100.
This metric connects marketing performance to the sales pipeline. Define an opportunity using evidence: a relevant problem, a suitable service and an agreed next commercial step. Opening a CRM deal automatically after every form submission makes the pipeline look larger without confirming real progress.
In our example, ten of forty qualified leads become opportunities, giving an opportunity rate of 25%. If you instead divide opportunities by held meetings, you obtain 50%. That second calculation describes meeting-to-opportunity conversion. Keep both labels precise if you use both.
Review a sample of opportunities with sales to check that the definition is applied consistently. Record why other qualified leads did not advance: no current project, service mismatch, internal delay or another reason. Avoid judging a campaign solely on a projected pipeline value that has not yet become accepted business.
6. Cost per opportunity: compare deeper outcomes
Formula: allocated marketing acquisition cost ÷ sales opportunities.
Cost per opportunity helps reveal campaigns that look inexpensive at the enquiry stage but create little commercial progress. Using SAR 12,000 of marketing cost and ten opportunities gives SAR 1,200 per opportunity. The calculation uses the same cohort and cost scope as our qualified lead example.
Do not compare two channels after radically different follow-up periods. A campaign launched yesterday has had less time to create opportunities than one running for several weeks. Show the cohort start date, its current age and the number of open records beside the metric.
A higher cost per opportunity may still be reasonable for a service with a longer buying process or a different project profile. Compare like with like and inspect actual outcomes. If one channel improves on this measure, use a controlled budget change and keep monitoring lead quality instead of assuming the improvement will continue at every spending level.
7. Customer acquisition cost: bring sales costs into view
Formula used here: allocated sales and marketing acquisition costs ÷ new customers from the matched cohort.
Customer acquisition cost, or CAC, answers a broader question than advertising cost per lead. Include the acquisition costs your team has agreed to count, such as allocated sales time alongside marketing costs. Document what is excluded so future reports remain comparable.
Our example includes SAR 12,000 of marketing costs and SAR 6,000 of allocated sales acquisition costs. If the cohort produces three customers, the observed CAC is SAR 6,000. If additional customers later close from that cohort, the result changes. Mark the cohort as still developing until your chosen observation period ends.
CAC alone does not establish profitability. Delivery costs, customer revenue, margin and retention are separate considerations. Use this marketing performance metric to understand acquisition efficiency, then evaluate it within your own business economics. If there are no customers yet, display “not available” and the customer count rather than reporting a misleading zero cost.
A complete marketing performance example
Illustrative scenario only: the following figures are invented to explain the calculations. They are not GrowMera client results, market benchmarks or performance promises. All outcomes refer to the same group of one hundred unique enquiries, observed over the same follow-up window.
| Metric | Calculation | Result |
|---|---|---|
| Qualified lead volume | Count of qualified leads | 40 |
| Qualification rate | 40 ÷ 100 × 100 | 40% |
| Cost per qualified lead | SAR 12,000 ÷ 40 | SAR 300 |
| Held meeting rate | 20 ÷ 40 × 100 | 50% |
| Opportunity rate | 10 ÷ 40 × 100 | 25% |
| Cost per opportunity | SAR 12,000 ÷ 10 | SAR 1,200 |
| Customer acquisition cost | (SAR 12,000 + SAR 6,000) ÷ 3 | SAR 6,000 |
The practical value comes from reading the stages together. If enquiries rise while qualified volume stays flat, investigate fit. If qualified volume rises while meetings stall, review the handoff. If opportunities rise while customers remain unchanged, inspect sales progress and allow enough time for the buying cycle.
A single customer can materially change a small cohort’s ratios. Keep the underlying counts visible, avoid ranking channels on tiny samples and explain unusual changes. A dashboard should help the team form a testable explanation, not hide uncertainty behind extra decimal places.
Connect website activity with CRM outcomes
Your website records an expression of interest; your sales process determines what happened afterwards. Create a shared record containing a unique lead reference, enquiry date, source, campaign where known, qualification status, stage dates, owner and next action. Record unknown sources explicitly rather than guessing.
For implementation, Google’s recommended GA4 events distinguish lead generation, qualification and conversion events. Your team still needs to configure and validate the connection between website actions and CRM updates. A successful form submission alone does not establish that a lead is qualified.
Google’s attribution paths documentation explains how recorded touchpoints receive credit for key events. Use that context when comparing channels. Our recommendation is to treat attribution as a reporting view; assigning credit does not, by itself, prove that one channel caused an additional sale.
Run a controlled test enquiry before relying on the data. Confirm that it appears once, carries the expected campaign information and can progress through the required stages. Mark test records clearly and exclude them from reporting. Reconcile a small set of real records between systems to locate missing or duplicate events.
Keep reporting views focused on the fields needed to make decisions. Internal operational details belong in the appropriate restricted CRM records. A useful marketing performance dashboard usually needs counts and stages rather than full copies of every enquiry message.

Turn marketing performance reports into weekly decisions
Use a short weekly review to check new enquiries, missing qualification decisions, held meetings and stalled opportunities. Let marketing explain acquisition patterns and sales explain what happened in conversations. Every agreed change needs an owner, a date and a metric that will show whether it helped.
A monthly review can compare cohorts at a similar age, reconcile acquisition costs and examine customer outcomes. Keep a simple change log for new targeting, revised landing pages, offer changes and follow-up adjustments. Without this context, the team may attribute an improvement to the wrong action.
| Observed pattern | Check first | Possible action |
|---|---|---|
| More enquiries, weaker qualification | Rejection reasons and audience fit | Clarify the offer or refine targeting |
| Healthy qualified volume, few meetings | Ownership, response process and booking | Remove a handoff delay |
| Meetings held, few opportunities | Needs, service fit and next steps | Improve qualification or discovery |
| Opportunities open without progress | Buying timeline and agreed actions | Confirm a realistic next step |
| Costs rising without better outcomes | Cost scope and comparable cohort age | Test one focused improvement |
Avoid changing targeting, creative, pricing and the sales process at the same time if you want to learn which adjustment helped. Choose one meaningful bottleneck, state the expected effect and observe it for a suitable period. Where decisions require stronger causal evidence, plan an appropriate controlled experiment.
Check the report before using it
Write the reporting currency, date range and last update beside the figures. Use the same time zone when matching website submissions to CRM entries near midnight. Check that repeated contacts about one project follow your chosen counting rule and that test enquiries are excluded.
When an old record changes status, keep its original enquiry date and add the date of the new stage. That preserves the cohort while making progress visible. Review missing source information as a data quality issue instead of assigning it to a preferred channel.
Before the review ends, write one sentence describing the decision, the responsible person and the next check date. This small habit connects the report to action and makes the next review easier to assess.
A practical 30-day setup plan
Week 1 — agree on definitions. Document the counting unit, qualification rules, opportunity criteria and cost scope. Select the initial cohort and assign responsibility for updating each stage.
Week 2 — validate the data. Test the enquiry journey, check campaign naming and reconcile website submissions with CRM records. Resolve duplicate leads and distinguish unreviewed records from rejected ones.
Week 3 — build the review. Show the seven metrics with underlying counts and observation dates. Review a sample of leads with sales and choose one bottleneck to improve.
Week 4 — evaluate the process. Check that records are updated and the improvement was implemented. Report early stage movement while keeping customer outcomes provisional where the buying cycle is longer than thirty days.
The first month establishes a reliable measurement habit. It does not guarantee a completed sales cycle or a specific return. Keep the framework simple enough that the team can maintain it after the initial setup.
Marketing performance questions
Which metric should a small B2B team start with?
Begin with qualified lead volume, qualification rate and held meetings. Add clearly scoped costs and opportunity outcomes as record quality improves. Track all seven when the underlying process supports them reliably.
Is a low cost per lead always good?
No. It can be useful, but only alongside qualification and downstream outcomes. A campaign with cheap enquiries can still require substantial effort to produce a relevant meeting or an accepted customer.
How often should we change the marketing budget?
Review operating issues weekly, but base larger changes on comparable cohorts, adequate observation time and your business constraints. One weak day or one unusually large opportunity is rarely enough context for a durable conclusion.
Can this framework work without an advanced CRM?
Yes. A shared spreadsheet can support the first version if records are unique, stage definitions are clear and one person owns the updates. Automation becomes useful when it reduces a known source of delay or error.
What should we do when a denominator is zero?
Show the metric as unavailable and keep the underlying count visible. Dividing cost by zero leads, opportunities or customers does not produce a meaningful acquisition cost.
Build a clearer view of your next growth decision
GrowMera connects acquisition, website conversion and the sales journey within a focused growth process. If your reports show activity but leave the next decision unclear, start by reviewing the path from enquiry to opportunity.
Explore our digital marketing services or tell us where visibility breaks down in your current workflow. We can discuss the definitions, pages and handoffs that would make your marketing performance easier to evaluate.